Has the Martí express been derailed? – Analysis Monday, 14th Oct 2024 16:42 by Andrew Scherer A blip linked to injuries to key players and a host of new signings settling down, or something to be more concerned about? Andrew Scherer crunches the numbers on QPR’s troubling start to the season. I read a post yesterday from someone who was stuck on the Chiltern Railways line because a train had hit the corpse of a cow. The cow in question had been hit by a different train two days prior, left by the side of the track, the corpse exploded, and promptly rolled back onto the track again. In entirely unrelated news, this week I’ve been going over QPR’s data for the season so far. I first did this for Loft for Words at the tail end of the Ainsworth era (‘we’re doomed’), again in January 2024 as the initial green shoots of a Cifuentes recovery seemed to die away in the bleak midwinter (’we’re probably still doomed’), and then one in the summer wrapping up last season (‘we’re... Maybe… ok?’). The big question in the last of those pieces was whether our positive form could be sustained into 2024/25, particularly with a summer of changes afoot. I wrote, with the prophetic-like insight of a man who’s watched QPR for too long: “As we know from bitter experience, putting together a run of results for a portion of one season is by no means a guarantee of success across the entirety of the next. It’s also interesting that our underlying numbers don’t look that different between the two Cifuentes periods. There’s an uptick in xG and our xGA actually gets a little worse, but the change isn’t commensurate with such a big shift in outcomes.” We’re nine league games into the new season and, with one win to our name, any progress seems once again to have ground to a halt against a metaphorical bovine carcass. So, with the international break upon us, it seems a good time to delve into the data to see what has (and hasn’t) changed and assess whether we should be reaching for any emergency stop buttons… Quick clerical points: All data taken from FBRef and Opta. As with my previous article, when we look at last season’s data I have divided into three sections: Ainsworth (14 games), Cifuentes - part one (13 games), and Cifuentes - part two (19 games). Headline numbersLooking at our performance in 2024/25 versus the league average for key metrics, you will be unsurprised to hear that we are underperforming across the board. Throwing in our equivalent metrics for the final 19 games of last season just serves to underline the change in our output.  You don’t need me to tell you we’re not scoring enough and conceding too many. But our expected goals (xG), which even during last year’s purple patch was below the league average, has dropped a little while our expected goals against (xGA) has increased significantly. On top of this, we are underperforming even these disappointing numbers: scoring fewer goals and conceding more than the xG would predict on average, meaning our points total is lagging behind our expected points (xP). A double whammy, then: our levels have dropped and the results are even worse than the performances suggest. One quick proviso to bear in mind is that nine games is a relatively small sample size, so be wary of drawing too many firm conclusions. But there are still some patterns starting to appear so let’s walk through some of the whys and wherefores and see if we can discern what is going on. Attack: blunt traumaOur attack has never been especially prolific under Cifuentes. Yes, our goals per game nudged over the league average at the back end of last season but our xG was still in bottom-half-of-the-table territory – at best we had an average attack. If you just compared the underlying numbers for 24/25 to that positive period last year (1.14xG/game to 1.16xG/game), the immediate temptation is to say ‘Oh we haven’t actually got that much worse in attack, last year we got a bit lucky and this year we’ve been pretty unlucky. It’ll work itself out over the course of the season’. Which is a reasonable(ish) high-level conclusion. Sitting through Millwall, or Derby, or Blackburn (even before the red card), the idea we’re not that different just doesn’t ring true though: I don’t think any neutral observer would argue that our offensive threat this year is comparable. Are our eyes playing tricks on us? And if we dig into the numbers in more detail, are there any clues as to what might have changed? Red signal: non-penalty xG per shot Non-penalty xG (npxG) per shot is just the xG a team generates (excluding penalties) divided by the total shots they take. It is, therefore, a measure of the average quality of chance a team creates. Let’s see how we currently measure up against last season. 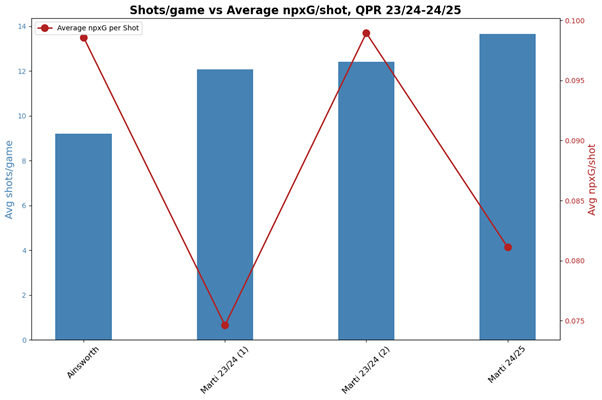 As you can see, the chances we created under Ainsworth were of a good level but there were far too few of them. Initially under Cifuentes that flipped to more chances with not enough threat but as we hit our stride in the new year we seemed to find a good balance of volume and quality. This term we are taking more shots than at any point in the last year but they have regressed to being less threatening again. If we are generating similar xG in total, does it really matter if it comes from fewer, higher quality shots or from more plentiful, lower quality shots? Absobloodylutely it does. What would you intuitively say is better: having two sitters in a game (say a one-on-one and a free shot around the penalty spot from a cutback) or ten potshots from outside the area? Well with a quick bit of maths (please stay) we can prove one is superior to the other. Let’s say Sitters FC are facing AFC Pot Shots. Sitters FC create their regulation two big chances in the game and each is worth 0.5xG, while AFC Pot Shots have their classic ten pops at goal, each of which are measured as 0.1xG. Both sides therefore finish the match with a total of 1.0xG. On paper, we might expect both teams to score. But what is the likelihood of either side failing to? As you may remember from GCSE maths papers of yore, to find the likelihood of two independent events both occurring you multiply the probability of the first by the probability of the second. So, to get the likelihood that Sitters FC score 0 goals, we take the 50% likelihood of them missing the first chance (0.5xG chances are, by definition, scored 50% of the time) and multiply that by the 50% likelihood of them missing the second chance, so simply: 50% x 50% = 25%. There is a 25% chance Sitters FC miss both their opportunities and draw a blank. The same principle applies to AFC Pot Shots. There is a 90% chance they miss each individual shot (0.1 xG equals 10% chance of scoring). So, to get the probability of the ten shots resulting in zero goals, we multiply 90% by 90% ten times, or (90%)10 = 34.87%. There is a 34.87% chance that none of AFC Pot Shots efforts end up in the back of the net. Their 1xG is more likely to yield zero goals. We can extrapolate this out for all potential goal totals in the same way and then run a Monte Carlo simulation to model the match 100,000 times and see who comes out on top most often. 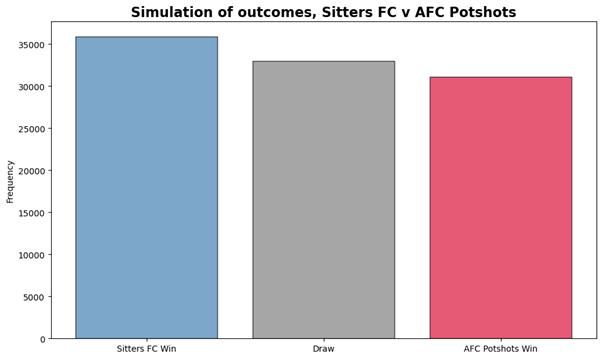 As you can see, despite the fact it is a very close game and both sides register exactly the same xG totals, the most likely result (occurring in 35.89% of simulations) is a Sitters FC win. So not all xG totals are equal. Which brings us back to Queens Park Rangers 2024/2025. Comparing last season’s xG numbers to this season’s, QPR currently look a lot more like AFC Pot Shots. Which, for those of you who made it this far, goes some way to explaining why it is unsurprising that we’re scoring fewer goals despite generating a similar average total of xG per game. Distance memories Having pinned down the drop in quality chances as a driving force behind our lack of goals, the next obvious question is: why are we creating less good chances? What’s changed? My first instinct was that, like AFC Pot Shots, we must be shooting from further out (distance is a big determinant of a shot’s xG rating: unless you are Jordan Hugill, it’s harder to miss from one yard out than twenty). In Cifuentes’ first 13 games in charge, our average shot distance was over 18.24m, among the furthest in the division. From the Millwall home game to the end of 23/24, this came down to a respectable average of 16.66m: lo and behold, the goals they did come. Average shot distance for QPR in 24/25? A perfectly respectable 16.63m, the 7th lowest in the league. Oh. Here is each team’s average npxG per shot plotted against their shot distance, with size of dot representing total number of shots (the larger the dot, the more shots). 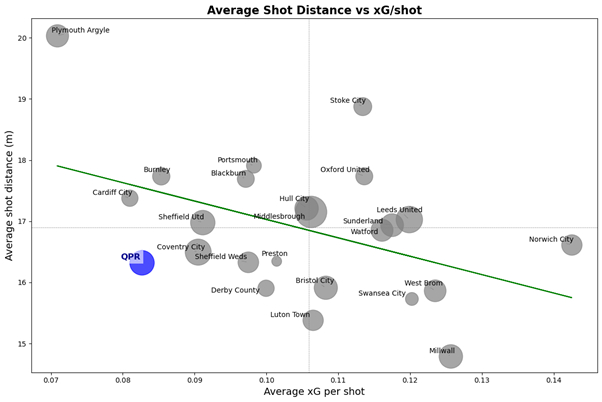 You can see that there is a clear inverse correlation between distance of shot and xG and we are taking a reasonable number of them – but our xG per shot remains stubbornly low. What is going on with this attack? Similar total xG to last year, similar shot distance, plenty of shots, but still producing low quality chances. What gives? Stumbling blocks To get to the bottom of the conundrum, let’s look in more depth at the individual shot data to see if any patterns there could help our understanding of what isn’t working so well. FBRef has six potential outcomes for a shot: Goal, Woodwork, Saved, Saved off Target, Off Target, and Blocked. Is there anything here that might be a clue to our poor conversion rate? 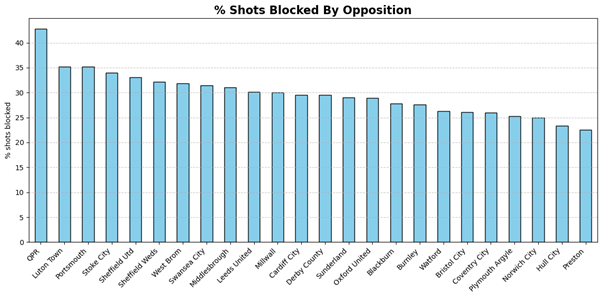 We really are head and shoulders above any other team for having our shots prevented from reaching goal. And xG takes into account the positioning of defenders and the pressure they are applying to the attacker, so while we’re shooting from reasonable distances, if we’re struggling to get a clear sight of goal it is unsurprising that our average xG per shot is down. When we plot percentage of shots blocked against average xG per shot, you can see there is a (weak) correlation but one team is a real outlier…arguably sufficiently so to have a serious impact on their xG. 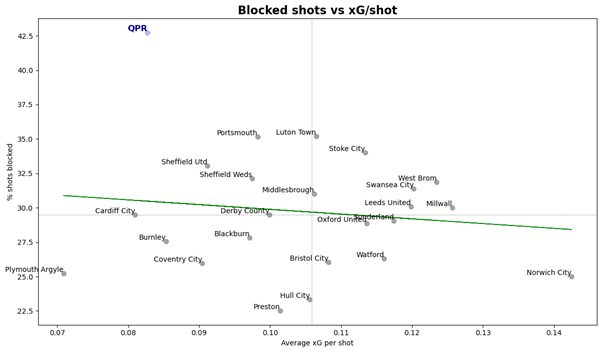 To reiterate, this may just be a quirk in the data that evens itself out as more games are played. But it’s a big old quirk. So, if we can say with some confidence that the outrageously high number of shots being blocked is a sticking point, that in turn begs the question: what are we doing differently that means teams are blocking nearly half our shots? Previously, we’ve looked at our passes into the final third and passes into the opposition penalty area to discern changes in our attacking output, with clear shifts between Ainsworth, Cifuentes’ first 13 games, and the final 19 games of last season. Adding in this year’s data shows…not very much has changed. 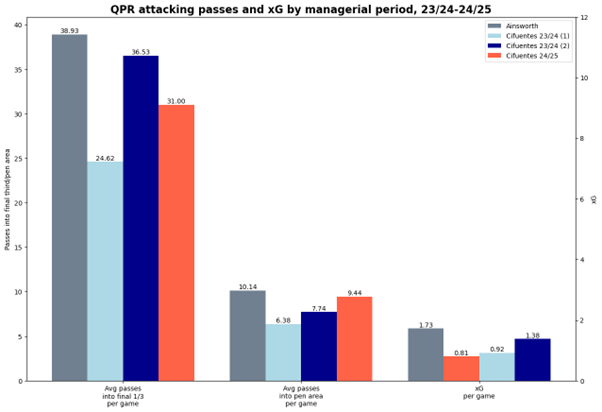 Marginally fewer passes into the final third, marginally more passes into the box, and a slight dip in xG – but nothing to suggest we’re suddenly struggling to progress the ball into good areas. And our average possession is also comparable: currently it’s 47.22%, in the final 19 games of last year it was 47% dead. Nothing to see here. Level crossing A notable feature of last term was that, under Cifuentes, we really pivoted to being a crossing side. QPR went from below average for number of crosses attempted to fourth highest in the league. Initially this was with limited success but as the season wore on we were increasingly good at getting on the end of balls into the box. So, if crossing is a key component of our attack, is there anything here that explains our drop in high-quality chance creation?  Yes. This season we are putting in a similar number of crosses per game - but with WAY less success. It’s worth reiterating the point around small data samples: this may just be an anomaly or bad luck. But with Chair out (responsible for 1.07 successful crosses per game in that second Cifuentes period – a whopping 41% of our total) and trying to bed in new players (Saito and Dembélé average 0.48 and 0.43 per game respectively – solid but combined still well below Chair’s output) it does feel like a lack of threat from out wide and therefore getting bogged down in crowded central areas is hurting us. This is useful insight but unlikely to explain fully the precipitous drop in quality chances and spike in blocked efforts. To do that we might need to take a step back. Never ahead, always behind Data on patterns of play and approaches to attack are undoubtedly useful but there is also a risk of getting bogged down in the minutiae and missing the big picture. And the big picture does offer us a thundering great clue as to why we seemingly just run into bodies when trying to get our shots away. We’re never ahead. This season, we have led for a grand total of 67 minutes. That’s it. Just over an hour across nine games, or roughly 8% of the time we have been on the pitch – the worst proportion in the league. We’ve only scored first in two games, haven’t done so since August, and those first goal leads lasted 10 and 25 minutes respectively. We are behind too often as well: 39% of the time, the third worst in the Championship. That is not a happy mix. In contrast, for the final 19 games of last season we had the fourth best record for time behind and ninth best for time ahead. In basic, big picture terms, if you are chasing games, the likelihood of coming up against a set, massed defence increases significantly. Which in turn means more blocks and fewer clear-cut chances. And that seems to hold very true for QPR: yes we progress the ball OK, yes our quality of delivery from wide has dipped, but fundamentally if we are forever giving opponent’s something to hold onto it is much harder to mount effective attacks. The good news is this doesn’t look too structural. Go ahead/stay ahead in a few games, get Chair fit and the new signings more settled, maybe have a touch more luck, and we may well see some improvements in our goal-scoring rates. I remain, for now, not too despondent about our attacking prowess. Defence: more gaps than an Avanti timetableOur defence though…well. It’s not panic stations yet but having pored through the data I’m more worried than I was. Care to let me drag you down with me? All change please Last season, the one thread that ran through Cifuentes’ QPR tenure while style and results bounced around was our relatively mean defence. We averaged one goal against per game and our expected goals against was a relatively steady 0.81/game in his first thirteen games then 0.92/game in the final 19 games. He built a very solid base and a team that was not particularly easy to score against. This year…not so much. As we’ve already seen, in 24/25 we are above average for xGA (1.38/game) and well above average for actual goals conceded (1.78/game). 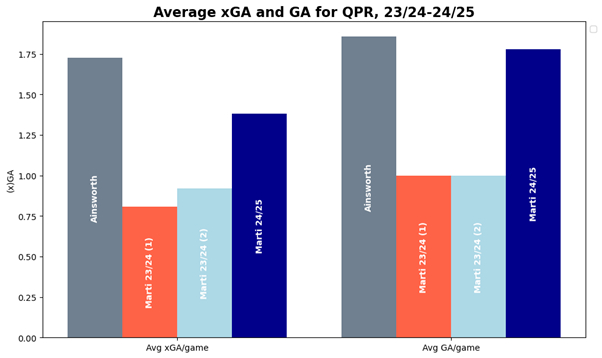 While I don’t for a second think this team is in as much trouble as they were this time last year, it’s hard to avoid the comparisons. And again, the data passes the eye test: I would say we just look too soft without the ball at the moment. Mitigations Lest we get too negative too quickly, we should review the mitigations. The gap between our xGA and actual goals conceded is the fourth highest in the league, which does suggest we (might) have had a little bad luck with good opposition finishing (Hull and Plymouth immediately springing to mind). And, as we’ve said throughout, we’re looking at a small sample size of matches. Back to reality Enjoy the mitigations? Right back to it. The first counterargument to the idea that we’ve been unlucky is the fact that Paul Nardi has already saved us a goal more than you’d expect, i.e. his saves have been worth 0.11/game in goals to us (versus an ‘average’ goalkeeper). If Begovic was still here and performing at the same level as last season (costing us 0.17 goals per game), we’d have already conceded 2.53 more goals. That does not scream unlucky. Secondly, with the benefit of our earlier maths lesson (what fun we have), we know that the higher the average quality of chance (npxG/shot), the more consistently you will score. This obviously holds true for opposition attacks as well. 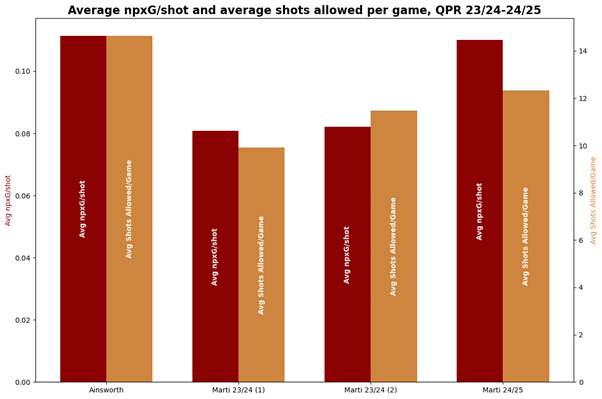 Per game, we are giving up more shots with more danger than at any previous point under Cifuentes. Our average of 0.11npxG/shot allowed is 18th in the league, compared to 0.08npxG/shot allowed in the final 19 games of last season which was only bettered by three teams. And while the increase in shots is, in itself, not especially significant (11.47/game to 12.33/game), when combined with the level of threat it makes for bad news. Distance memories, part two Returning to another earlier lesson (so much learning), we know that distance is important when assessing chance quality. 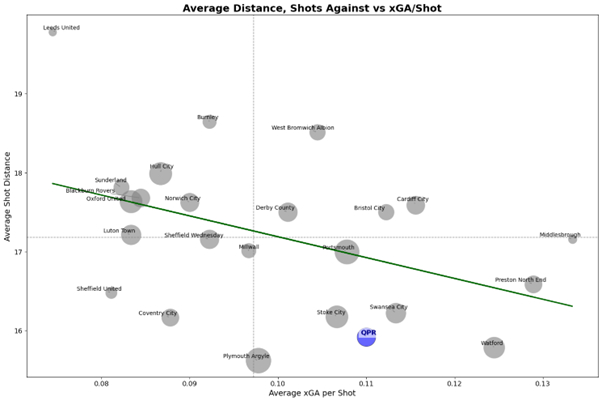 Our record of allowing shots from an average distance of 15.92m is the third worst in the league and, at the risk of labouring the “we were better last year” point this has dropped from 18.61m, the third best in the league. So, there is no mystery as to why our average npxG/shot against is so high: we are simply letting teams get into very good scoring positions close to goal. Stopping service Why are we so much more vulnerable? One of the things that categorised QPR’s defensive strength during our survival-securing run-in was the fact we seemed less bothered about allowing teams to progress into our defensive third but once there we adopted a thou shalt not pass rearguard action, allowing proportionally far fewer balls into the box and and less xGA. In 24/25 our passes allowed into the defensive third is still well above average (3rd highest in the league) but we appear to have lost the solid base behind that, now also allowing the second highest number of passes into the penalty area. 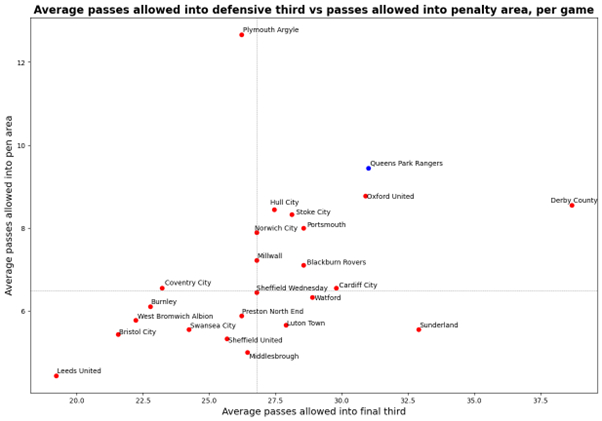 Another way of looking at it is this: currently teams will, on average, create 1xG worth of chances from just under 23 passes into our defensive third. In the final 19 games of last season it took them a remarkable 39.55 passes to create the same level of threat. We are, in other words, wide open. Tackling the problem Some of this openness may well be down to the same reason we struggle to create high quality chances ourselves: we are behind so much (and lead so infrequently) that we have to chase games and are therefore more exposed. But the data suggests there is a little more to it than this. One thing that’s got me reaching for the emergency stop button is our tackling data. From January to May, consistent with our strong low block, our average tackles per game in the defensive third was 9.26 – the third highest in the league. Thus far in 24/25 it is just 6.89, the fifth lowest. But we’ve made up for it with more bite in midfield, right? Right? 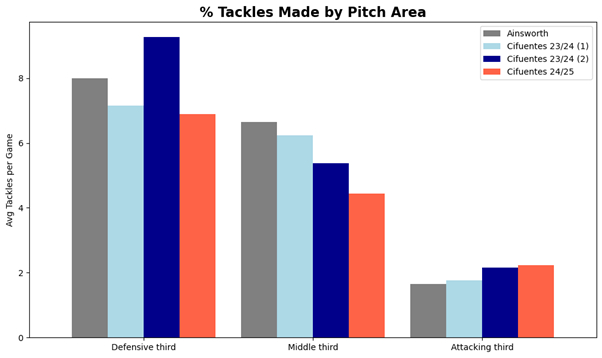 We have not made up for it in midfield: we currently average 4.44 tackles per game in the middle third, less than any other Championship side. And while there is the slightest inkling of a higher press (we make the 8th most tackles when our opponents are in their own third) this does not come close to making up the difference: in total we are bottom of the league for tackles made. Well, we’re chasing games, maybe we’re stopping breaks with lots of tactical fouls instead? Nope, we’ve conceded the third fewest free kicks. What about that high press, maybe our passes per defensive action (PPDA – the measure of how actively a team defends) shows we’re trying to influence things, albeit unsuccessfully? Fraid not, bottom for that too. Do we…*wincing*…plug the hole with interceptions? Oh you better believe we’re bottom for those as well. You can, of course, try to explain all of this away. We’ve been missing key players through injury and suspension; we have an Isaac Hayden shaped-hole while his replacement(s) bed in; we need to get our noses in front to give us something to defend; it’s only nine games; the players are only just hitting full match fitness. Maybe. Maybe. But taken at face-value, we’re too open, too soft, too passive, and too unstructured. I can squint at the attacking numbers and feel like there’s something there to hang my hat on. Currently I cannot really do that with the defence. To revisit a Tuckerism I used to describe our defence’s start to last season, we are edging back into marzipan dildo territory. An unusual source of comfort I cannot finish with a dildo, though. So, allow me to conclude with the one bright spot that we have carried through from last year: we’re still OK at set pieces! 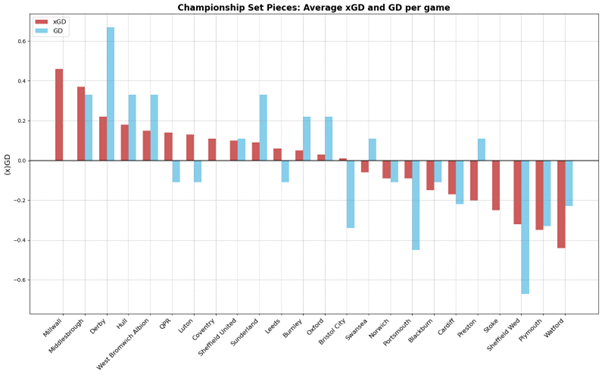 As you can see, we have the sixth best expected goal difference in the league from dead balls. This is driven predominantly by our attacking threat: we have the fifth highest total for both goals scored (3) and xG (0.37/game). Defensively we are a little more average on paper, sitting in 11th for set piece xGA (0.23/game) and we have underperformed that to concede four goals (0.44/game). But set pieces are, relatively speaking, something we can cling to: if we carry on at this level then it’s more likely than not that we’ll nick a few points from them. And if we’re doing comparisons with Ainsworth’s Rs, that is a very clear, positive difference. ADDENDUM I wrote the above section not quite in a hurry, but certainly with the mindset of getting the piece done and finding a semi-positive note on which to end. Subsequently reading Dan Lambert’s always excellent analysis of our defensive set pieces, however, serves as a timely nudge that glancing at statistics and drawing broad brush conclusions without really thinking about what you’ve been watching can be a fool’s errand. Dan also highlights that the data shows we are 11th in the league for xGA from dead balls – but then goes on to show that lurking behind this are structural flaws in our set up which the opposition are systematically exploiting (this also goes some way to explaining why we are underperforming our set piece xGA). Interestingly there is, perhaps, a common thread from his insights around the lack of blocks and tackles going in on men around the box and the pitiful overall defensive numbers discussed here. But the main takeaway is the reminder that numbers only get you so far (and to read Dan's articles). We can still shift the cowWhen I sat down to write this article I would have characterised my feelings on our performances so far as ‘not great but it’s still early days’. The Martí express isn’t currently motoring but the cow carcass felt shiftable.  (Artist’s impression. No animals were harmed in the making of this article.) I think, in general terms, I can still just about get behind this sentiment (if not that picture). Until we have more games under our belts (particularly ones where we actually score first) I would be hesitant to write us off. It’s more likely than not that at least some of the new signings will improve. And if/when Clarke-Salter and Chair start playing regularly again we’ll have upgrades in two key roles. But after looking at the defensive data I am more worried than I was. The age-old fear that QPR are just easy pickings for more disciplined, determined teams appears to be manifesting again. The signs of progress are pretty non-existent. And there are just too many fundamentals not working for it to be explained away by circumstance. I will finish, however, with another quote from my final article of last season: “And whoever ends up lining up for us after September 2, on the evidence to date you wouldn’t bet against Martí finding solutions to make it work.” I don’t think Cifuentes has become a poor manager over the summer. We were in a far more perilous situation last year and he turned it round, seemingly out of nowhere. I don’t think the squad at his disposal is so weak that he cannot get a tune out of it. It may take time, it may even get worse before it gets better, but I think we will ultimately be OK. Just not as OK as we’d hoped in June. More from this author >>> Destroyer of optimists >>> Light at the end of the tunnel? >>> A season in three thirds If you enjoy LoftforWords, please consider supporting the site through a subscription to our Patreon or tip us via our PayPal account loftforwords@yahoo.co.uk. Pictures — Ian Randall Photography The Twitter @scheza, @loftforwords Pictures - Ian Randall Photography Please report offensive, libellous or inappropriate posts by using the links provided.
You need to login in order to post your comments |
Blogs 31 bloggersCharlton Athletic Polls |
