Light at the end of the tunnel, or a train coming towards us? – Analysis Wednesday, 17th Jan 2024 18:41 by Andrew Scherer Are QPR an improving team under Marti Cifuentes with a revival just around the corner, or is there worse still yet to come? Columnist Andrew Scherer is back for a second crack at digging into the numbers for a data-based look at just exactly how slim QPR’s chances of survival are. Back in the October international break, I wrote on the numbers behind QPR’s pretty catastrophic start to the season. My conclusion was - unsurprisingly - we were in trouble. I summed up as follows: “Survival does rest on significant improvements. If we find a way to utilise Ilias Chair better, if we stem the steady flow of dangerous passes through our midfield, if we - shock horror - make even a little progress on set pieces, I think we have a puncher’s chance.” Since then we have changed head coach, our style of play, and (to some extent) our results. But things seem to have regressed again of late, with no win and a paltry three goals in our last six league outings. The football has been easier on the eye but have we actually got much better? Are the team’s weaknesses a question of fundamental ability, inherent mental fragility, or both? And are we, ultimately, destined for the drop? Let’s take a look. [All data is taken from fbref.com, apart from the set-piece xG numbers, which are from Opta] Headline numbersLooking at the headline numbers, there is no question that we have improved since Cifuentes took over (despite the recent drop-off in form). I think most QPR observers would say the shift is fairly obvious but it is worth looking at the data to quantify it. Under Ainsworth we averaged 0.92 expected points (xP) per game - the second worst in the league. Since Cifuentes arrived, that is up to 1.42 xP/game (10th in the league in this period, above the overall league average of 1.37). That improvement is largely driven by the significant tightening of our defence: since Ainsworth’s dismissal we have only allowed an average of 0.80 xGA per game, less than half of our 1.65 xGA per game under Wild Thing (and significantly below the league average of 1.29 xGA/game). That is a big turnaround and we’ll look at what’s driving it shortly. You will also be unsurprised to hear that we haven’t seen an equivalent improvement in attack: there has only been a small bump in our chance creation, with our average xG per game only creeping up slightly from 0.81 to 0.93 (against a 1.29 league average). Nevertheless, if we look at the league table arranged by expected points, our improvements would typically have been enough to have pulled us out of the bottom three. 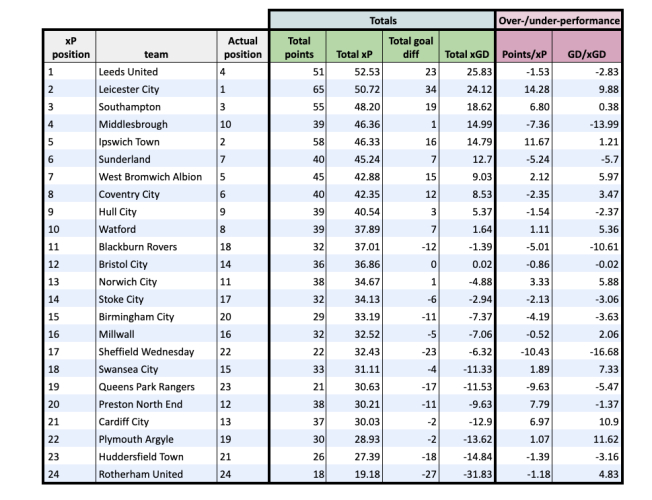 In reality, of course, this hasn’t happened. So, what has changed at the back? Why aren’t we seeing a similar change up top? And why haven’t our actual points caught up with our fairly impressive improvement in expected points? De-fence, De-fenceAttacks win you games, as the old adage goes, and defences win you titles (or, perhaps, survival). And for the first three months of the season our defence was in marzipan dildo territory for the amount of value it offered. It is, therefore, no surprise to see Cifuentes focus his attention first and foremost on keeping the opposition out (and let’s not forget, he has been here for 11 weeks, in which we have played 14 games of association football - so there is going to have to be some prioritisation in how time is spent on the training pitch). This (presumed) defensive focus is paying off across a number of key indicators: as well as the drop in expected (and actual) goals against, we are facing fewer shots: an average of 9.92 per game under Marti, compared to 14.2 under Ainsworth and a league average of 12.58. And those shots are less threatening: shots against Ainsworth’s QPR had an average non-penalty xG (npxG) of 0.11 (6th worst in the league) while shots against Cifuentes’ QPR have an average npxG of 0.08 (3rd best in the league). We are giving up fewer chances and those that we do allow are less threatening. How have we done this? One thing that jumped out of the data when we looked at it in October was the ease with which teams progressed the ball up the field and into our area - which led to the volume of high-quality chances given up. We were just so wide open that teams could not only play into our defensive third at will, a significant proportion of those attacks also saw the opposition get into our area. Happily, the opposite is now true. 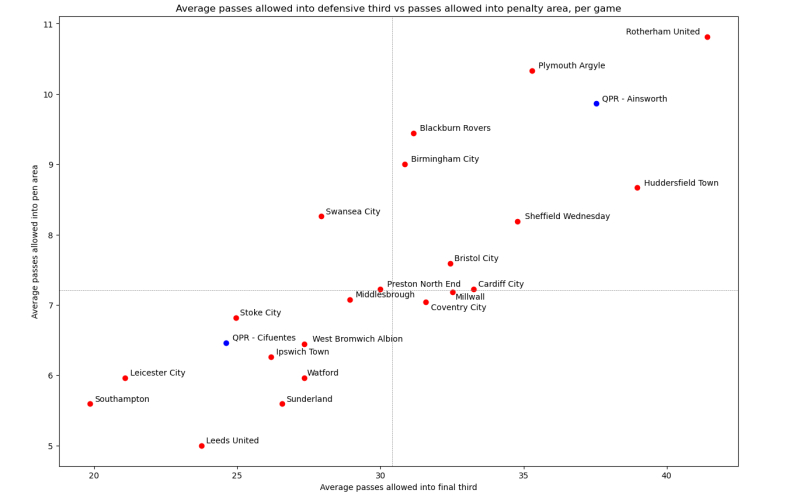 It is simply much harder to progress the ball against us: we have gone from allowing an average of 37.53 passes into our final third (worst record in the league) and 9.87 passes into our area (third worst in the league) to 24.62 passes into our final third (fifth best) and 6.46 passes into our area (seventh best). And while we are not a particularly high pressing team (as measured by opposition passes per defensive action - PPDA), we do engage much more actively: our PPDA under Marti is 15.93, down from 19.52 Ains (the league average is 16.1). This passes the eye test: our structure out of possession since Cifuentes has come in has looked a lot more solid and disciplined. We do attempt to press high up the pitch at opportune moments, but we are quick to drop back a little deeper into shape once it looks like that initial press hasn’t yielded possession. We have conceded 13 goals since the change in manager; in that same time period the only teams with a better defensive record are Southampton (6 goals), Leeds (10), and West Brom and Coventry (both 11). To state the bleeding obvious, if you stop teams from getting the ball into dangerous areas, you concede fewer goals. At least from open play. 6 of the 13 league goals conceded under Cifuentes have come from set pieces. You don’t need to be a football expert to recognise that just isn’t sustainable. And while our xGA/game from set pieces has come down slightly from where it was in October (0.38/game to 0.31/game), it is still way too high, particularly for a side that struggles to score goals itself. For a far better explainer than I could offer on why this is happening, I would encourage you to read Dan Lambert’s excellent piece from last week. One thing that Dan does a great job of highlighting is that all the questions about planning, positioning etc are pretty academic if the players are not doing the basics. And as Dan concludes, when they make such simple errors so frequently, it is tempting to discern a mentality issue there. This sense is compounded when you look at data from open play. Excluding set pieces, only 8.53% of crosses against us are successful, the sixth best ratio in the league. But given time to think, time to switch off, lining up in a series of one-on-one battles in the area, QPR players are regularly second best. And as we shall see later, this lack of edge, this missing-in-action killer instinct, does manifest elsewhere in the data. Attack. Attack. Attack attack attack.Overall, we are defending a lot better as a team. But our attacking output has barely shifted: we have gone from 0.81 xG/game and 0.73 goals/game to 0.93 xG/game and 0.92 goals/game. What has (or hasn’t) changed going forward? In October, I concluded that the core of our troubles was an inability to get the ball into dangerous areas. Once there, we actually fashioned OK-ish chances and our finishing wasn’t awful, but we just couldn’t get enough possession in the final third to generate those chances. The good news is this has been addressed (to a degree). The bad news is we have found another way not to score. Let’s revisit the graph I used last time showing how we measure up against the league for average passes into the final third, passes into the penalty area, and xG per game. [NB I have plotted xG on a secondary y-axis for readability] 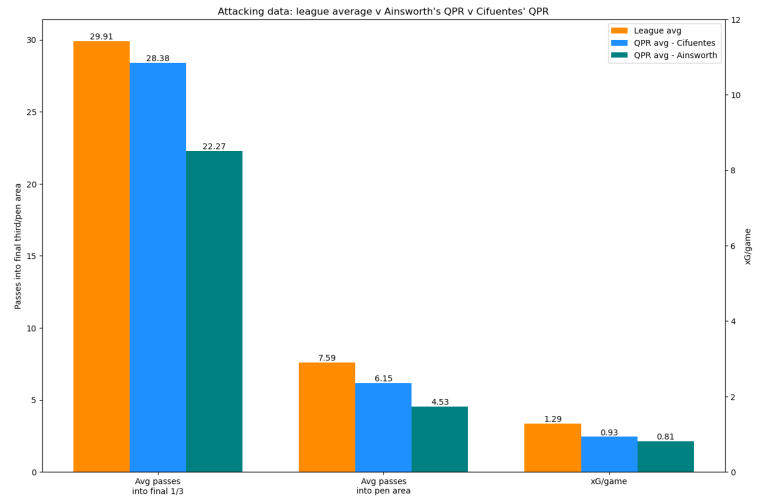 As you can see, we are now getting the ball forward more effectively (albeit still below average). Chair, Dixon-Bonner and, to a degree, Willock are starting to positively influence games in terms of progressive passes. But why is the end result much the same in terms of xG created? For Cifuentes’ QPR, it’s not the size (of attacking possession) that counts, it’s what you (don’t) do with it. Having got the ball into the final third more, we are taking more shots: 12.08/game compared to 9.4/game (league average 12.42/game). But our average shot distance has crept up from 17.25m (actually better than the league average of 17.61m) to 18.22m. Consequently, our non-penalty xG per shot has declined from 0.1 npxG/shot under Ainsworth to 0.08 under Cifuentes - the third worst ratio in the league. Essentially, once we get into the final third, we struggle to break down the opposition and often just end up shooting from distance. There is some mitigation here: the return of the Illy/Willy axis - which has clearly been given licence to shoot from outside the area - has yielded goals. But the data does tell the story of a side that doesn’t really know how to translate attacking possession in the final third into meaningful chances. This also chimes with something Cifuentes has referenced as a weakness in several post-match interviews: decision-making in attack. At this juncture, it is worth pointing out that our lack of xG is not a case of a dogmatic coach enforcing a death by a thousand passes approach. Since Cifuentes took over we are 12th in the league for percentage of passes played long and our possession per game has ranged from 35% (Hull) to 75% (Plymouth). He certainly appears to be taking a pragmatic, caballos for courses approach. To illustrate this further, I have plotted all our matches this season on a possession against xG graph (with the wins in red). As you can see, there is a positive correlation between having the ball and creating more chances but…all of our victories have come with 50% or less possession. 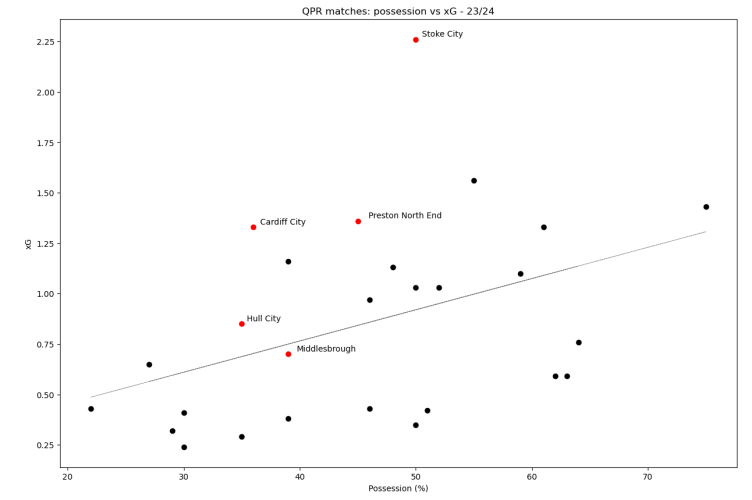 Our limited number of wins naturally means we are looking at a pretty small sample size, but there may be something to this: it certainly feels like we are better attacking in transition, before defenders have recovered their shape, than we are breaking down a well-set deep- or mid-block. And I suspect that opponents have figured out - particularly after our mini win streak - that giving up the ball against us may not be the worst idea in the world. So our attacking troubles have shifted from getting the ball forward to what we do with it when we are there. (Game) state of mindUnder Cifuentes, we are a lot tighter as a defensive unit but still concede soft goals. We get the ball forward more effectively but once there struggle to create chances. Are these shortcomings at the business ends of the pitch a symptom of a wider cognitive malaise in this QPR squad? Whether that is a lack of focus, a lack of caring, a comfort with mediocrity, or a combination of all three, fans have called it out, the media have called it out, and former managers have called it out. The risk, however, is that we over-interpret what we see and use it to justify our existing opinions and cognitive biases. I therefore wanted to explore if there was any other way the data might give more hints at an underlying mental fragility. So I spent some time looking at how we perform by game state. Game state simply refers to whether a team is winning, drawing, or losing (and/or by how much). It gives us another dimension through which to measure a team’s actions: for example, chances created when a match is level are more valuable than those fashioned at 3-0 up. My hypothesis was that a well-drilled side with a soft underbelly would struggle to convert tight games into points. So, let’s plot overall points total against percentage of time spent either drawing, leading by one, or trailing by one. 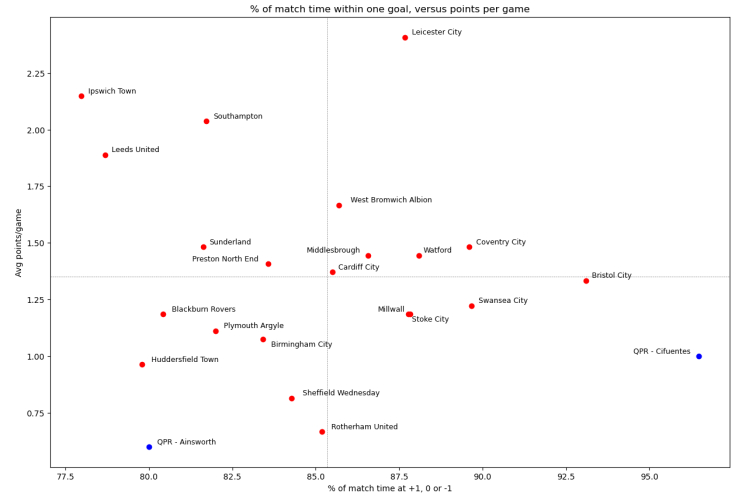 Teams in the bottom left quadrant tend to lose games comfortably; those in the top left win games at a canter, top right is sides that pick up points from tighter games, and bottom right is teams which are in a lot of close games but struggle to convert that into points. Hello outlier! Since Cifuentes took over, we have comfortably spent the most amount of time a goal up, a goal behind, or level of any side in the league (the average across the season for the league is 84.85%; under Cifuentes we have spent 97.25% of time in this game state). And if we splice the data another way and look at points versus time spent level or ahead, the sense we are close but not quite there is compounded… 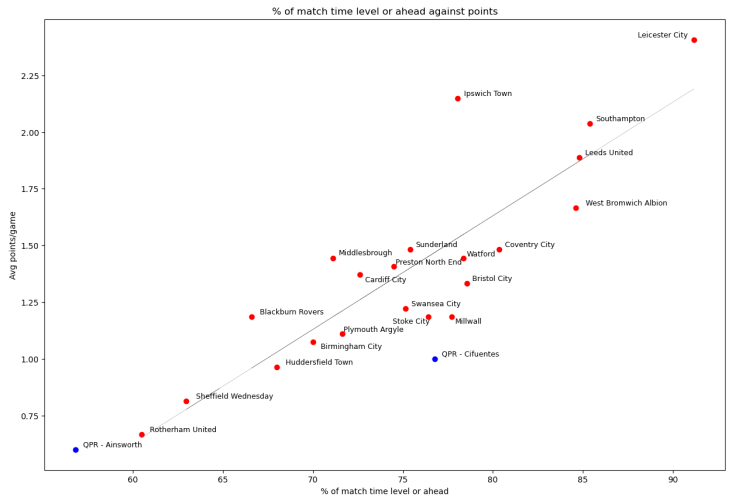 Sides above the trend line are those who win more points relative to the total time they spend level or ahead; sides below the line are those who win fewer points than you would expect. You will note that we are the worst underperformers in the league by this measure: using this (admittedly simplistic) model we are 0.47 points per game worse off than you would expect on average for a side who spends the amount of time we do level or ahead. Inevitably, teams that spend a greater proportion of that time level rather than ahead are more likely to be underperformers. But Stoke (70.5%), Bristol City (63.5%) and Sunderland (59%) are all comparable to our 60.5% of time level - and they are yielding between 0.18 and 0.48 points/game more than us: a difference of up to 22 points across 46 matches. There is no doubt we are a lot more competitive now. But in a game of fine margins, we end up on the wrong side too frequently. You could argue that all of the above reflects our relative improvements/struggles: we are better defensively so are ‘in’ a lot more matches, but we don’t have the firepower either to get back into games once we go behind or to convert draws into wins. You could, however, also argue that this betrays our mental fragility: when it comes to the crunch - whether in our box or the opposition’s - we consistently come out on the wrong side. The reality is probably a little bit of both. Enough of your infernal numbers, will we stay up or not?!Hopefully this look at the data has given you a better sense of where we are at. We have progressed from a team that looked nailed on for relegation to one that - on the underlying numbers at least - looks pretty mid-table. But having effectively given everyone a head start, we are likely to need an even bigger improvement than that to stay up. The bookies have us ranging from 8/11 for relegation (implied ~58% chance of going down) to 4/9 (69% chance). I reckon we’re probably in the middle of that spread, somewhere around 65%. With my optimistic hat on, we are not that far off. We have the sort of defensive base that will give us a fighting chance in most games (and a passable goal difference, should it come to that). With that now established (and the manic Christmas period done), Cifuentes and his coaching team may have more time to focus on improving our attacking output - and the Watford game did at least see us create plenty of chances. If (GIANT if) we stop conceding quite so many goals from set pieces, that will yield a slew of points. Play consistently like we did on Sunday and some wins will follow. I am inclined to believe the new CEO when he says we don’t have any scope to make signings this window, but were we to make one or two shrewd additions that might be just enough to nick a few more tight games. However, as we have seen, there may be various reasons behind our underperformance that stop us from closing the gap between expected points and actual points. Realistically, set pieces are going to be an ongoing theme. We haven’t been consistently threatening in attack for a long time. And if we start to lose touch with the teams above us, I wouldn’t be overly surprised to see this squad throw in the towel. So what do we need to aim for? Although 52 is the magic total, 50 points keeps you up in 9 of the last 10 seasons. 43 points keeps you up half the time. And 38 points (2021/22) is the lowest total for survival in this time period. We are currently averaging a point per game under Cifuentes. Carry on at that rate and we’ll be on 40 points and all but down. But our expected points per game under Cifuentes is 1.42. If, for the sake of argument, we revert to the mean expectation and do manage to bank 1.42/game from our remaining 19 matches, that leaves us on 48 points - which would have us safe in eight of the last ten seasons. Unfortunately, this is not each of the last ten seasons. The teams around us have started picking up, and those who might have got dragged in have either made a change in the dugout or have a pretty healthy buffer to us already. 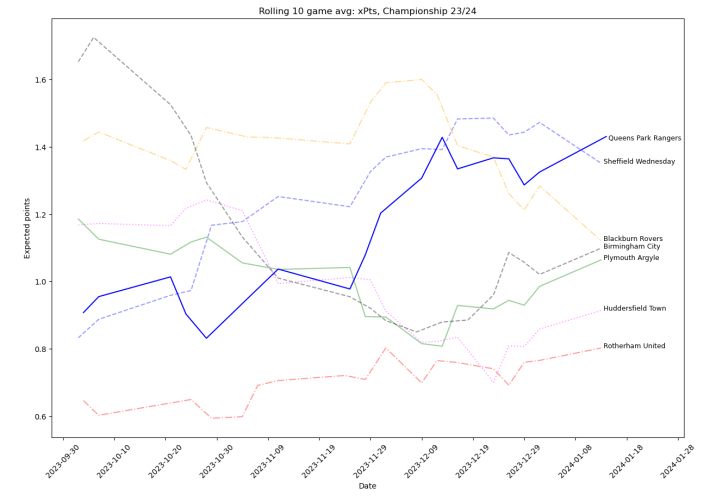 Looking at the rolling ten game average for expected points, you can see we have undoubtedly improved - but so have Danny Röhl’s Sheffield Wednesday side. Birmingham City’s (blue)nose-dive has been arrested and you have to assume Tony Mowbray’s appointment will go at least some way to reversing the damage inflicted by the Wayne Rooney brains trust. Plymouth look mediocre but no worse than that. So as things stand, this looks like a season where it will take a higher than average points total to avoid the drop. Which will be tough for us to achieve. You want me to nail my colours to the mast? Alright. Here’s my predicted final table for the bottom half of the Championship, using a blend of expected points and actual points to forecast final totals. 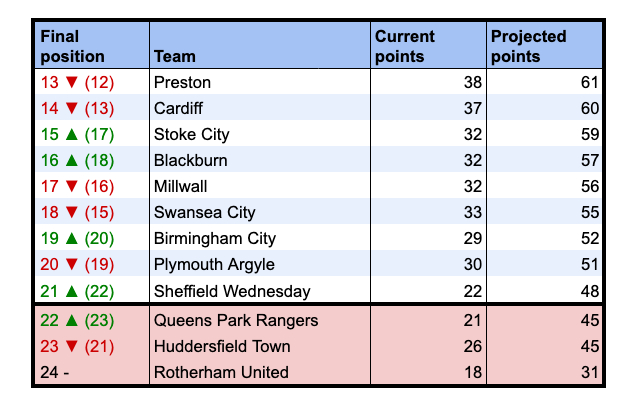 Sorry. On current trends, I think Rotherham are done for and we may haul in Huddersfield. But Wednesday now look like they have enough about them to just about steer their way to safety, Birmingham have probably corrected their Rooney experiment with sufficient time to retrieve the situation, and Plymouth have got enough points on the board that the swing required to overtake them looks just a little too big. There are, of course, teams that go on late runs (good and bad) which can change the picture. Blackburn are currently cratering (one win, one draw, seven defeats in their last nine) and they have a tough run-in. Plymouth could do with their new manager to bedding in quickly. But to take advantage of any such struggles, we need to put points on the board and we need to do it quickly. I’m not putting a fork in the paella and downing my Spanish brand lager quite yet, but we’re getting close. More from this author >>> Destroyer of optimists If you enjoy LoftforWords, please consider supporting the site through a subscription to our Patreon or tip us via our PayPal account loftforwords@yahoo.co.uk. Pictures — Ian Randall Photography The Twitter @scheza, @loftforwords Ian Randall Photography Please report offensive, libellous or inappropriate posts by using the links provided.
You need to login in order to post your comments |
Blogs 31 bloggersBlackburn Rovers Polls |
